Status Bar
View scene information at a glance
The status bar shows the current scene state, selected object details, simulation time, performance metrics, and other runtime and project information.
Information labels
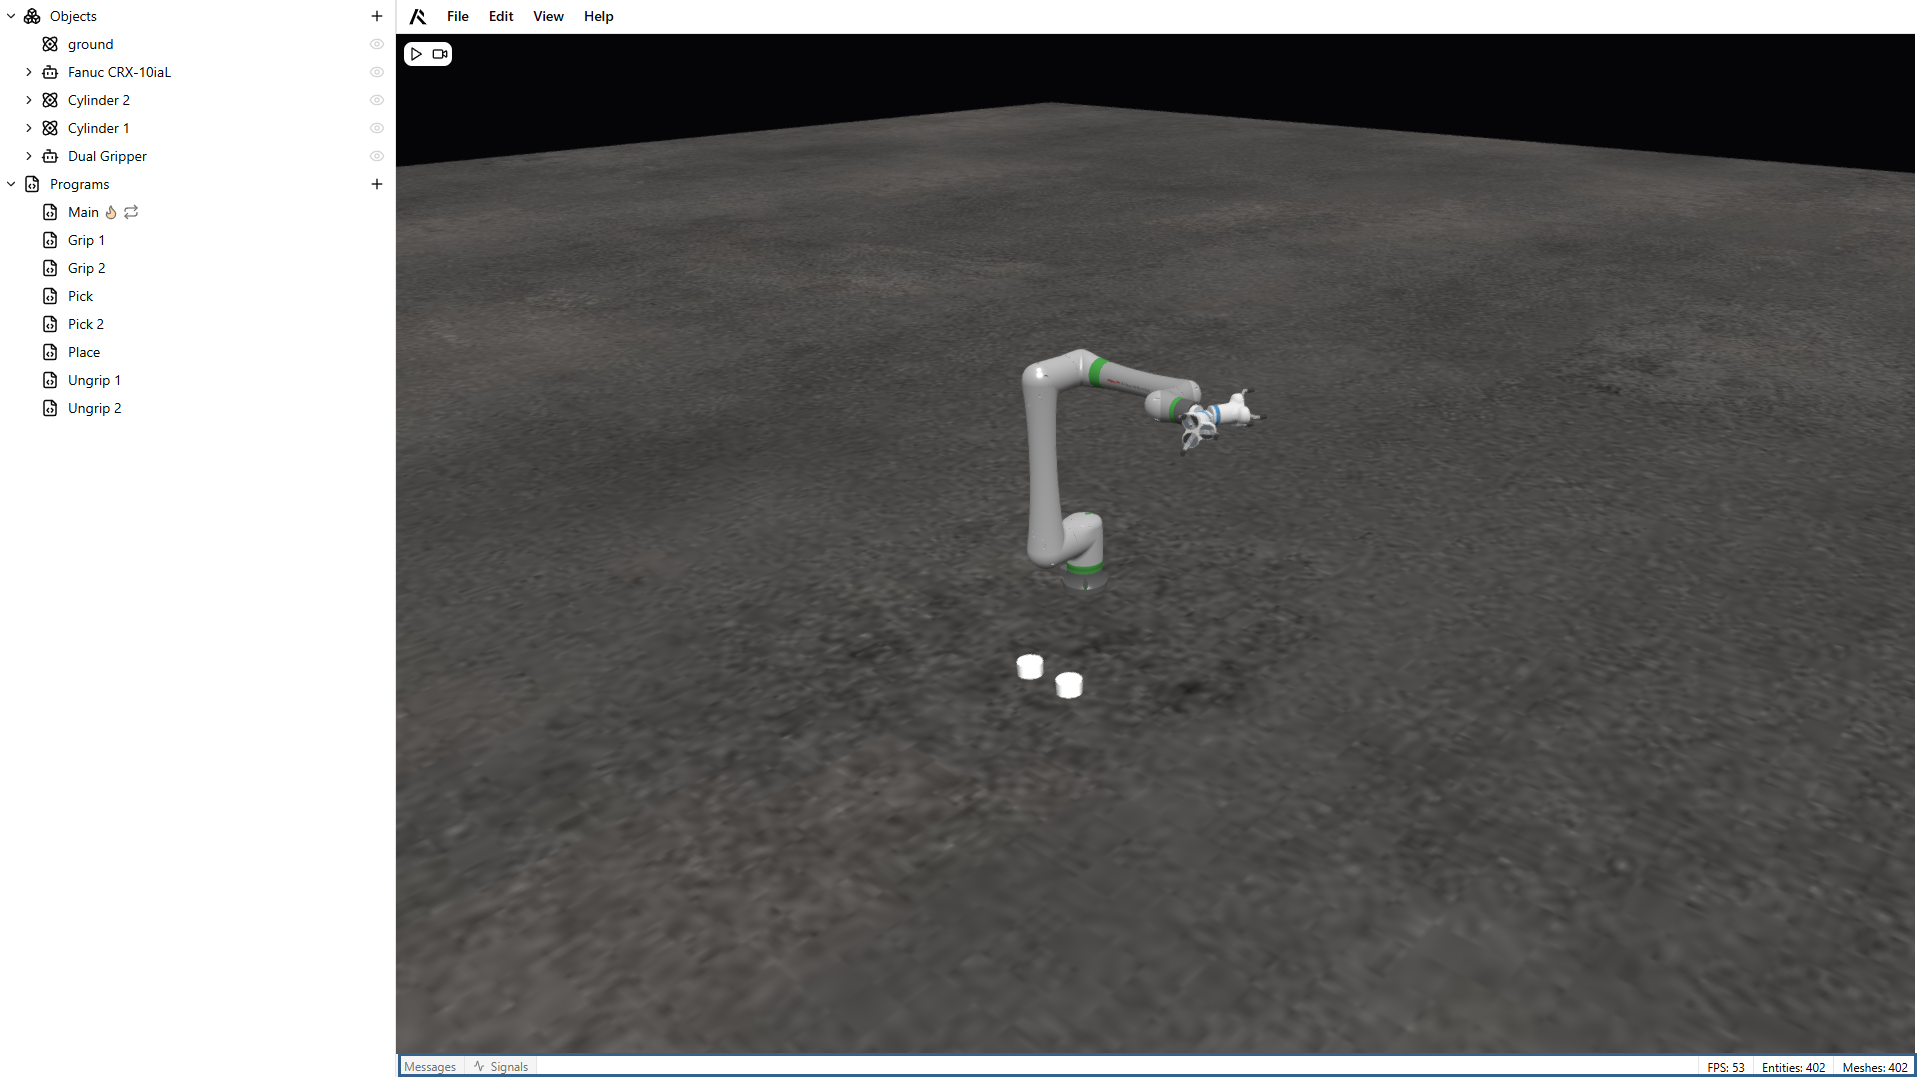
The right side of the status bar shows key project and simulation data so you can monitor performance and progress.
- Number of entities: total number of nodes in the scene tree.
- Number of meshes: total number of meshes in imported models.
- Selected object: object currently selected in the scene tree.
- FPS: current frames per second.
- Time: shown only while the simulation is running; indicates elapsed simulation time.
Messages Tab
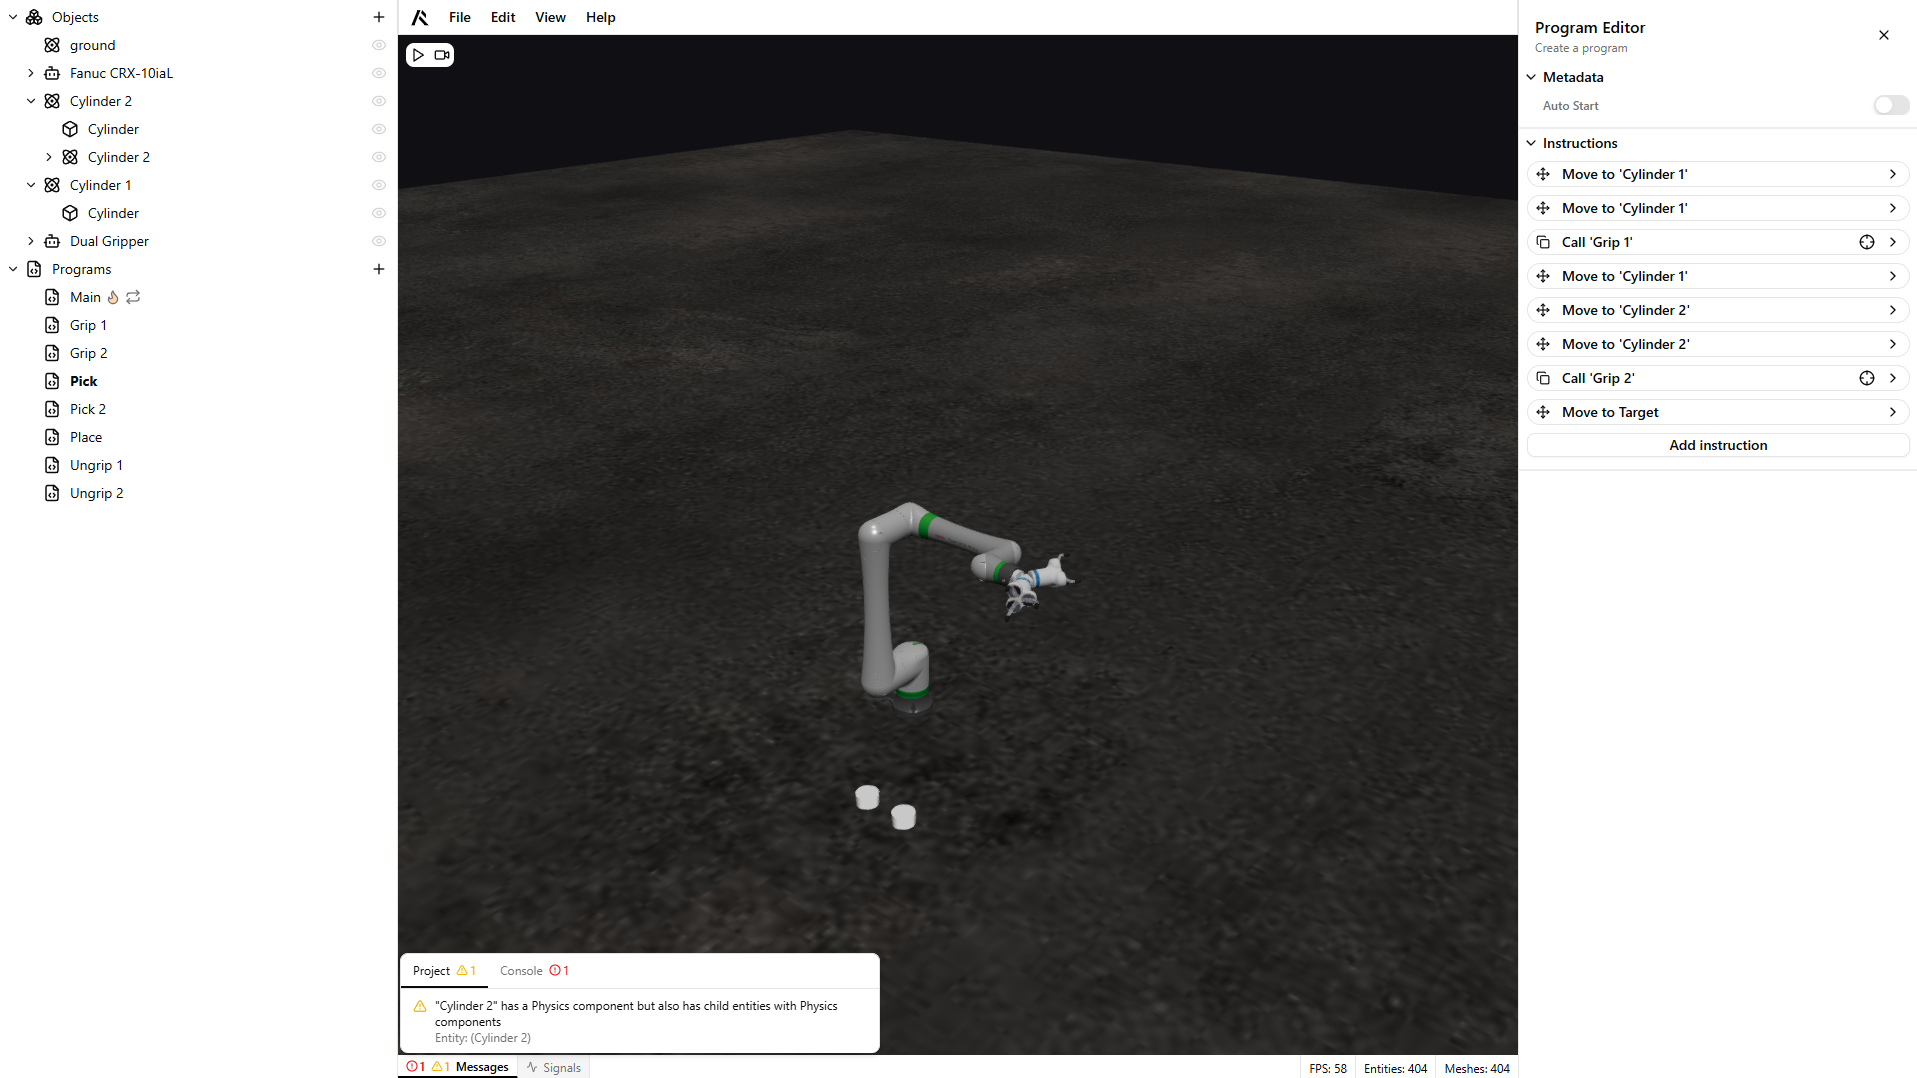
On the left side, the Messages tab shows both project messages and console messages.
Project messages
Project messages appear during edit time. They are usually related to scene tree issues or incorrectly configured components and programs.
There are two types of project messages:
- Warnings: non-blocking recommendations that can improve the simulation.
- Errors: critical issues that block simulation startup because they can affect stability or performance.
You can click an issue in the Project tab to jump directly to the part of the project that needs attention.
Console messages
Console messages report events and issues that occur during simulation runtime (while the simulation is running).
There are three types of console messages:
- Information: user-generated informational messages printed during runtime.
- Warnings: runtime issues that may require attention.
- Errors: critical runtime issues that stop the simulation.
Signals tab
The Signals tab shows the real-time state of global and entity signals.
This tab updates continuously, which helps you debug signal-related behavior during simulation.
For more information, see the Signals page.